measure of intensity histogram for shape
Histogram measure computes the histogram of intensities for the shape, given the following parameters:
- histogram minimum and maximum; there are 3 ways to define them:
- the user specifies minimum and maximum of his choice
- they are initialized with the minimal and maximal intensities of the image
- they are initialized with the minimal and maximal intensities of the shape
- the bin width, or the number of classes of the histogram
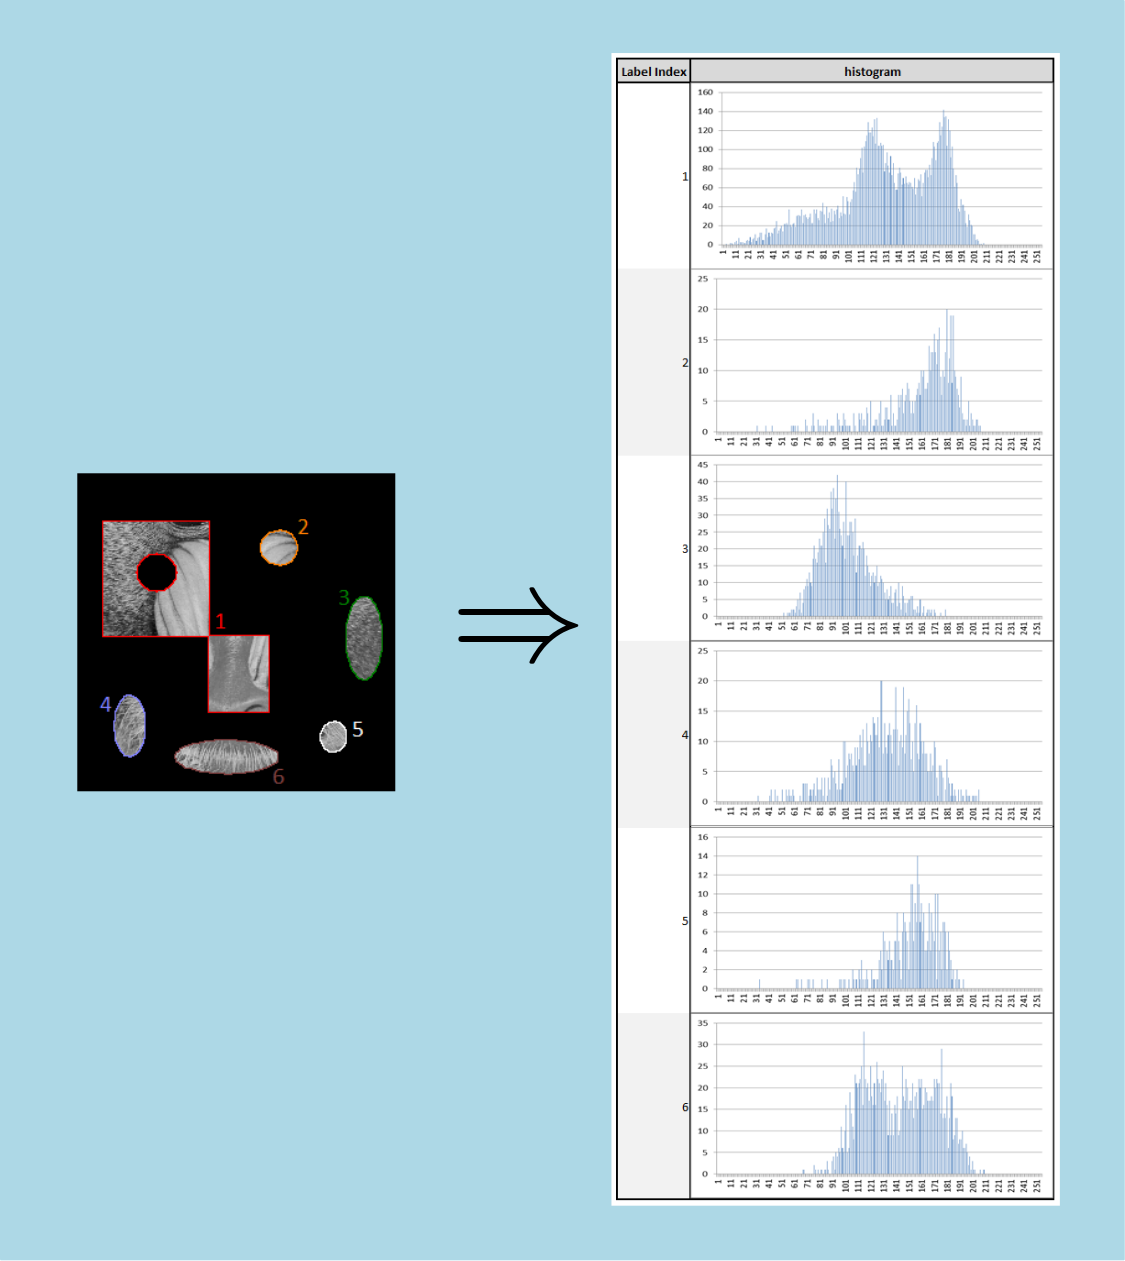
Here is an example of histogram measurement:
measure of intensity histogram for shape
Measure synthesis :
| Measure Type | Measure Unit Type | Parameter Type | Result Type | Shape Requirements |

Intensity
|

None
|
HistogramMsrParams |

Custom
|

Row Intersections
|
See Shape measurement for additional information on these pictograms Example of Python code :
Generic example in 2d case :
import PyIPSDK
import PyIPSDK.IPSDKIPLShapeAnalysis as shapeanalysis
inMeasureInfoSet2d = PyIPSDK.createMeasureInfoSet2d()
PyIPSDK.createMeasureInfo(inMeasureInfoSet2d, "HistogramMsr")
outMeasureSet = shapeanalysis.labelAnalysis2d(inGreyImg, inLabelImg2d, inMeasureInfoSet2d)
PyIPSDK.saveCsvMeasureFile(os.path.join(tmpPath, "shape_analysis_results.csv"), outMeasureSet)
outMsr = outMeasureSet.getMeasure("HistogramMsr")
outMsrValues = outMsr.getMeasureResult().getColl(0)
print("First label measurement equal " + str(outMsrValues[1]))
Generic example in 3d case :
import PyIPSDK
import PyIPSDK.IPSDKIPLShapeAnalysis as shapeanalysis
inMeasureInfoSet3d = PyIPSDK.createMeasureInfoSet3d()
PyIPSDK.createMeasureInfo(inMeasureInfoSet3d, "HistogramMsr")
outMeasureSet = shapeanalysis.labelAnalysis3d(inGreyImg, inLabelImg, inMeasureInfoSet3d)
PyIPSDK.saveCsvMeasureFile(os.path.join(tmpPath, "shape_analysis_results.csv"), outMeasureSet)
outMsr = outMeasureSet.getMeasure("HistogramMsr")
outMsrValues = outMsr.getMeasureResult().getColl(0)
print("First label measurement equal " + str(outMsrValues[1]))
Example of C++ code :
Example informations
Associated library
IPSDKIPLShapeAnalysis
Code Example
Shape2dCollPtr pShape2dColl = boost::make_shared<Shape2dColl>();
readFromXmlFile(inputShape2dCollPath, *pShape2dColl);
MeasureInfoSetPtr pMeasureInfoSet = MeasureInfoSet::create2dInstance();
HistogramMsrParamsPtr pHistoMsrParams;
switch(minMaxDef.value()) {
pHistoMsrParams = createHistogramMsrParamsMinMaxImgBinWidth(1.0);
break;
case eMinMaxDefinition::eMMD_ShapeMinMax:
pHistoMsrParams = createHistogramMsrParamsMinMaxShapeBinWidth(1.0);
break;
pHistoMsrParams = createHistogramMsrParamsBinWidth(1.0, fMin.get(), fMax.get());
}
createMeasureInfo(pMeasureInfoSet, "HistogramMsr", pHistoMsrParams);
MeasureSetPtr pOutMeasureSet =
shapeAnalysis2d(pInGreyImg2d, pShape2dColl, pMeasureInfoSet);
const MeasureConstPtr& pHistogramOutMsr = pOutMeasureSet->getMeasure("HistogramMsr");
const HistogramMsrResults& outResults = static_cast<const HistogramMsrResults&>(pHistogramOutMsr->getMeasureResult());


 1.8.14
