Compute the intensity of the most populated class.
HistogramMostPopulatedGL computes, for given histogram parameters (bin width or number of classes, and the way to determine histogram minimal and maximal intensities), the mean grey level associated to the most populated class in the histogram computed on the shape.
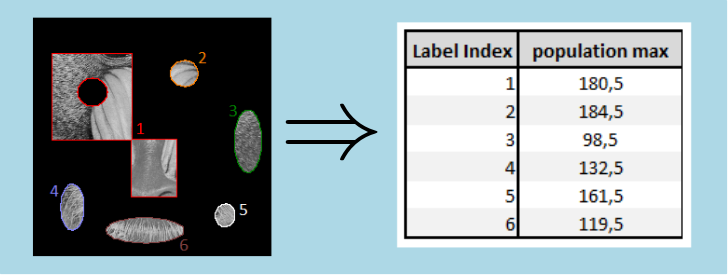
Here is an example of histogram most populated grey level measurement in 2d case :
Compute the intensity of the most populated class
Measure synthesis :
| Measure Type | Measure Unit Type | Parameter Type | Result Type | Shape Requirements |

Generic
|

None
|
HistogramMostPopulatedGLMsrParams |

Value (ipsdk::ipReal64)
|

Row Intersections
|
See Shape measurement for additional information on these pictograms Example of Python code :
Generic example in 2d case :
import PyIPSDK
import PyIPSDK.IPSDKIPLShapeAnalysis as shapeanalysis
inMeasureInfoSet2d = PyIPSDK.createMeasureInfoSet2d()
PyIPSDK.createMeasureInfo(inMeasureInfoSet2d, "HistogramMostPopulatedGLMsr")
outMeasureSet = shapeanalysis.labelAnalysis2d(inGreyImg, inLabelImg2d, inMeasureInfoSet2d)
PyIPSDK.saveCsvMeasureFile(os.path.join(tmpPath, "shape_analysis_results.csv"), outMeasureSet)
outMsr = outMeasureSet.getMeasure("HistogramMostPopulatedGLMsr")
outMsrValues = outMsr.getMeasureResult().getColl(0)
print("First label measurement equal " + str(outMsrValues[1]))
Generic example in 3d case :
import PyIPSDK
import PyIPSDK.IPSDKIPLShapeAnalysis as shapeanalysis
inMeasureInfoSet3d = PyIPSDK.createMeasureInfoSet3d()
PyIPSDK.createMeasureInfo(inMeasureInfoSet3d, "HistogramMostPopulatedGLMsr")
outMeasureSet = shapeanalysis.labelAnalysis3d(inGreyImg, inLabelImg, inMeasureInfoSet3d)
PyIPSDK.saveCsvMeasureFile(os.path.join(tmpPath, "shape_analysis_results.csv"), outMeasureSet)
outMsr = outMeasureSet.getMeasure("HistogramMostPopulatedGLMsr")
outMsrValues = outMsr.getMeasureResult().getColl(0)
print("First label measurement equal " + str(outMsrValues[1]))
Example of C++ code :
Example informations
Associated library
IPSDKIPLShapeAnalysis
Code Example
Shape2dCollPtr pShape2dColl = boost::make_shared<Shape2dColl>();
readFromXmlFile(inputShape2dCollPath, *pShape2dColl);
MeasureInfoSetPtr pMeasureInfoSet = MeasureInfoSet::create2dInstance();
HistogramMostPopulatedGLMsrParamsPtr pParams;
switch(minMaxDef.value()) {
case eMinMaxDefinition::eMMD_ShapeMinMax:
pParams = createHistogramMostPopulatedGLMsrParamsBinWidth(1.0);
break;
pParams = createHistogramMostPopulatedGLMsrParamsBinWidth(1.0, fMin.get(), fMax.get());
break;
}
createMeasureInfo(pMeasureInfoSet, "HistogramMostPopulatedGLMsr", pParams);
MeasureSetPtr pOutMeasureSet =
shapeAnalysis2d(pInGreyImg2d, pShape2dColl, pMeasureInfoSet);
const MeasureConstPtr& pHistogramMostPopulatedGLOutMsr = pOutMeasureSet->getMeasure("HistogramMostPopulatedGLMsr");
const ipsdk::shape::analysis::ValueMeasureResult<ipsdk::ipReal64>& outResults = static_cast<const ipsdk::shape::analysis::ValueMeasureResult<ipsdk::ipReal64>&>(pHistogramMostPopulatedGLOutMsr->getMeasureResult());


 1.8.14
