image = | shapeFiltering2dImg (inBinLabImg,inFilterFormula) |
image = | shapeFiltering2dImg (inBinLabImg,inGreyMsrImg,inFilterFormula) |
image = | shapeFiltering2dImg (inBinLabImg,inFilterFormula,inOptMeasureInfoSet2d) |
image = | shapeFiltering2dImg (inBinLabImg,inGreyMsrImg,inFilterFormula,inOptMeasureInfoSet2d) |
Shape 2d filtering algorithm.
This algorithm allows to filter an input binary or label image with respect to a shape analysis measure formula.
OutImg output image type is given by InBinLabImg input image type which can be a binary or a label image.
This is a packaged algorithm which can be decomposed into the following steps :
- A first optional step which allows to compute connected components on input image and to obtain a label image (see Connected Component 2d).
- A second step allowing to extract a polygon approximation of previous labels contours. This stage is controlled by InOptContourExtractionSettings attribute (see Label shape extraction 2d)
- The main shape analysis step including formula computation. Used InFilterFormula formula must be evaluated to a valid measure logic formula (see Logic Formula and Shape Analysis 2d). InGreyMsrImg is a grey level (or color) image which can be used to compute intensity measurements.
Additional measures definition can be provided using InOptMeasureInfoSet2d attribute. This allows to create user custom parametred measures (such as histogram quantile which depends on a target quantile value).
- The final step simply consists in a lut transformation. An input shape will then retrieve its original value (1 for a binary image or its label index for a label image) if it matches requested InFilterFormula formula.
Here is an example of shape 2d filtering operation where all small shapes are removed (used formula :
)
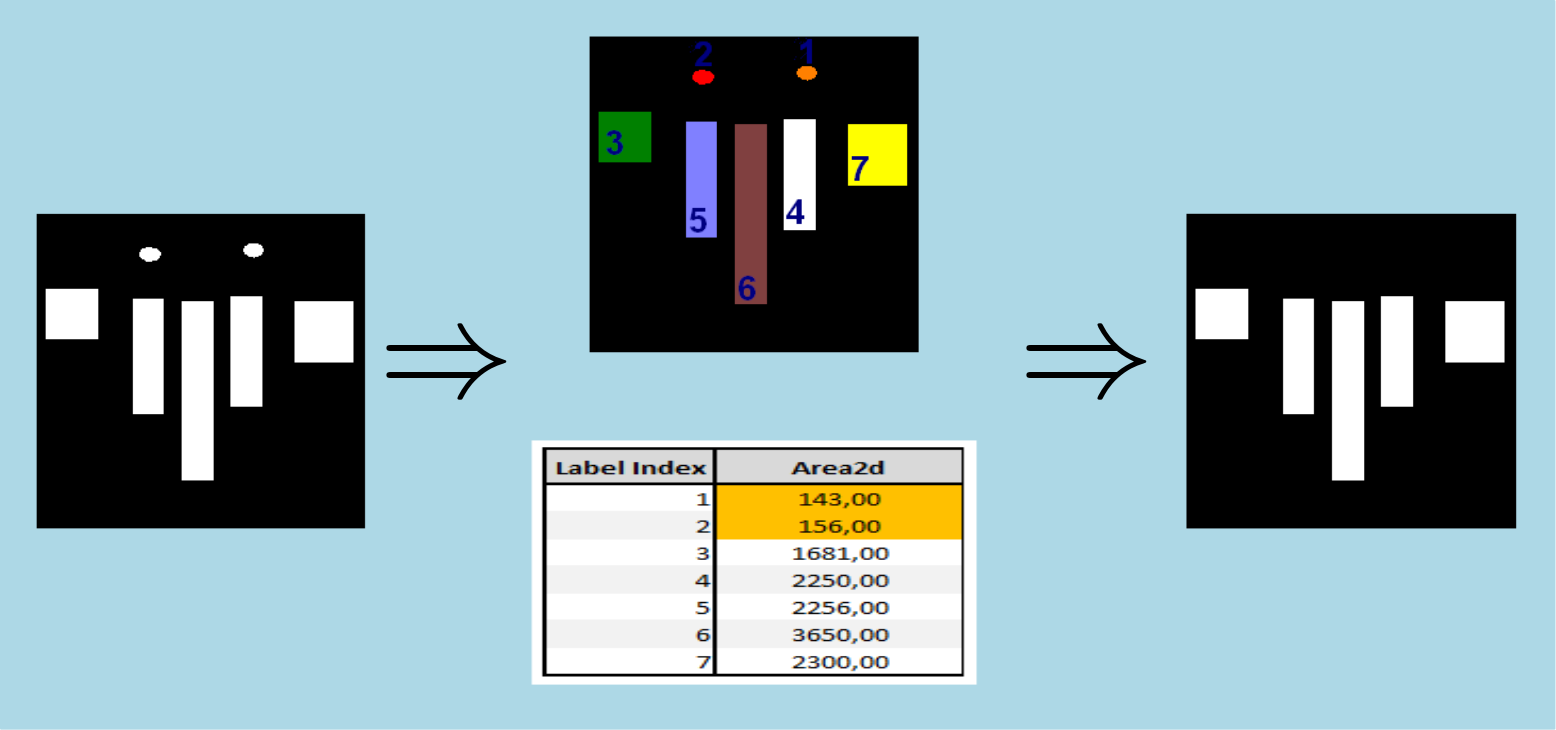
In this case input binary image (on the left) is filtered using a geometric criterion. Intermediate label (connected components) image and measurement results are displayed (on center) before final binary image result (on the right).
Here is an example of shape 2d filtering operation using an intensity criterion (used formula :
).
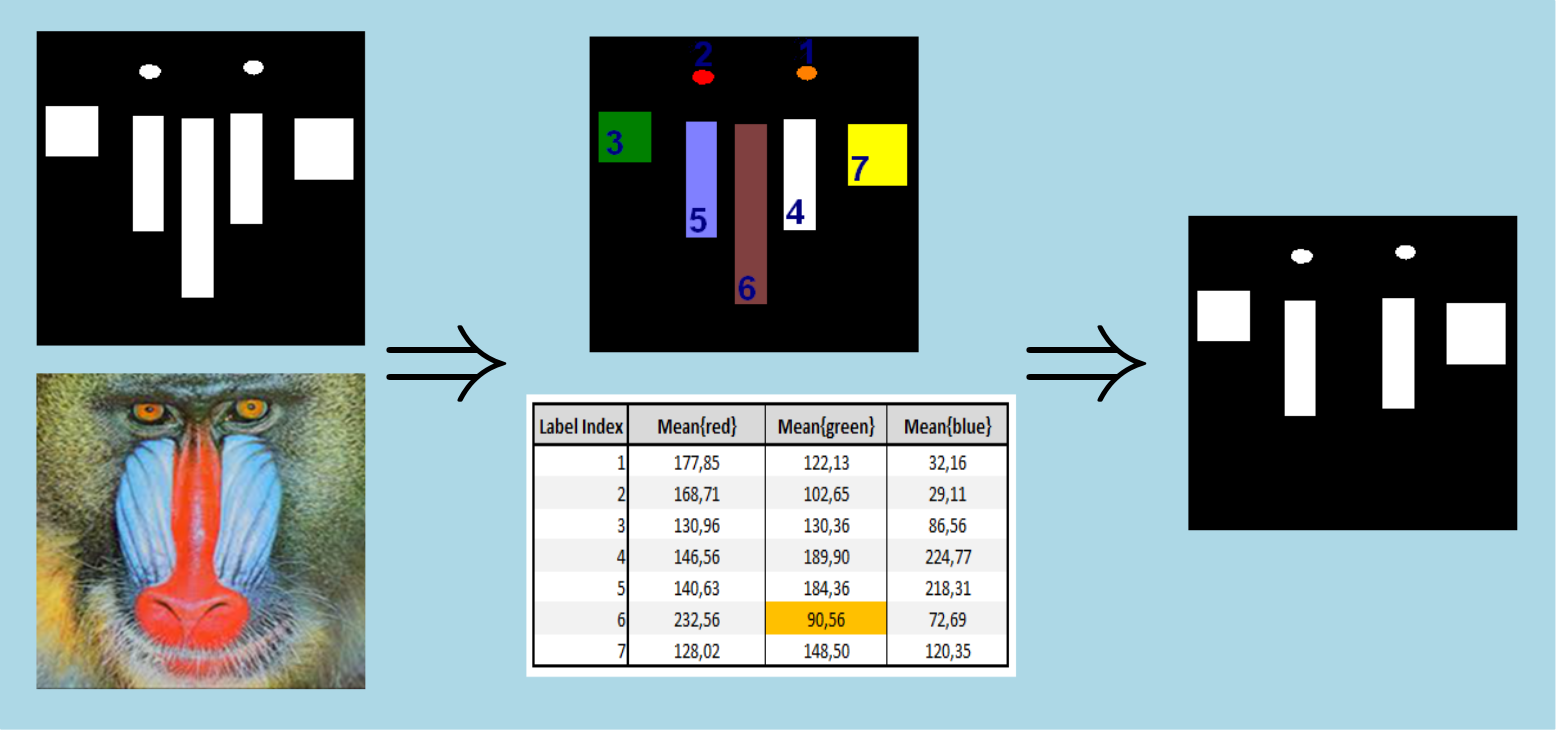
In this case input binary image (on the left) is filtered using a grey image (on the left) as analysis and measurement support. Intermediate label (connected components) image and measurement results are displayed (on center) before final binary image result (on the right).
Example of Python code :
Example imports
import PyIPSDK
import PyIPSDK.IPSDKIPLShapeAnalysis as shapeanalysis
Code Example
inBinImg = PyIPSDK.loadTiffImageFile(inputBinImgPath)
outImg1 = shapeanalysis.shapeFiltering2dImg(inBinImg, "Area2dMsr > 1000")
inGreyImg = PyIPSDK.loadTiffImageFile(inputGreyImgPath)
measureInfoSet = PyIPSDK.createMeasureInfoSet2d()
PyIPSDK.createMeasureInfo(measureInfoSet, "MyQuantileMsr", "HistogramQuantileMsr", shapeanalysis.createHistogramQuantileMsrParamsBinWidth(1.0, 75.0))
outImg2 = shapeanalysis.shapeFiltering2dImg(inBinImg, inGreyImg, "MyQuantileMsr > 170", measureInfoSet)
Example of C++ code :
Example informations
Header file
#include <IPSDKIPL/IPSDKIPLShapeAnalysis/Processor/ShapeFiltering2dImg/ShapeFiltering2dImg.h>
Code Example
const std::string formulaStr1 = "Area2dMsr > 1000";
ImagePtr pOutImg1 = shapeFiltering2dImg(pInBinImg2d, formulaStr1);
MeasureInfoSetPtr pMeasureInfoSet = MeasureInfoSet::create2dInstance();
const std::string formulaStr2 = "MyQuantileMsr > 170";
ImagePtr pOutImg2 = shapeFiltering2dImg(pInBinImg2d, pInGreyImg2d, formulaStr2, pMeasureInfoSet);