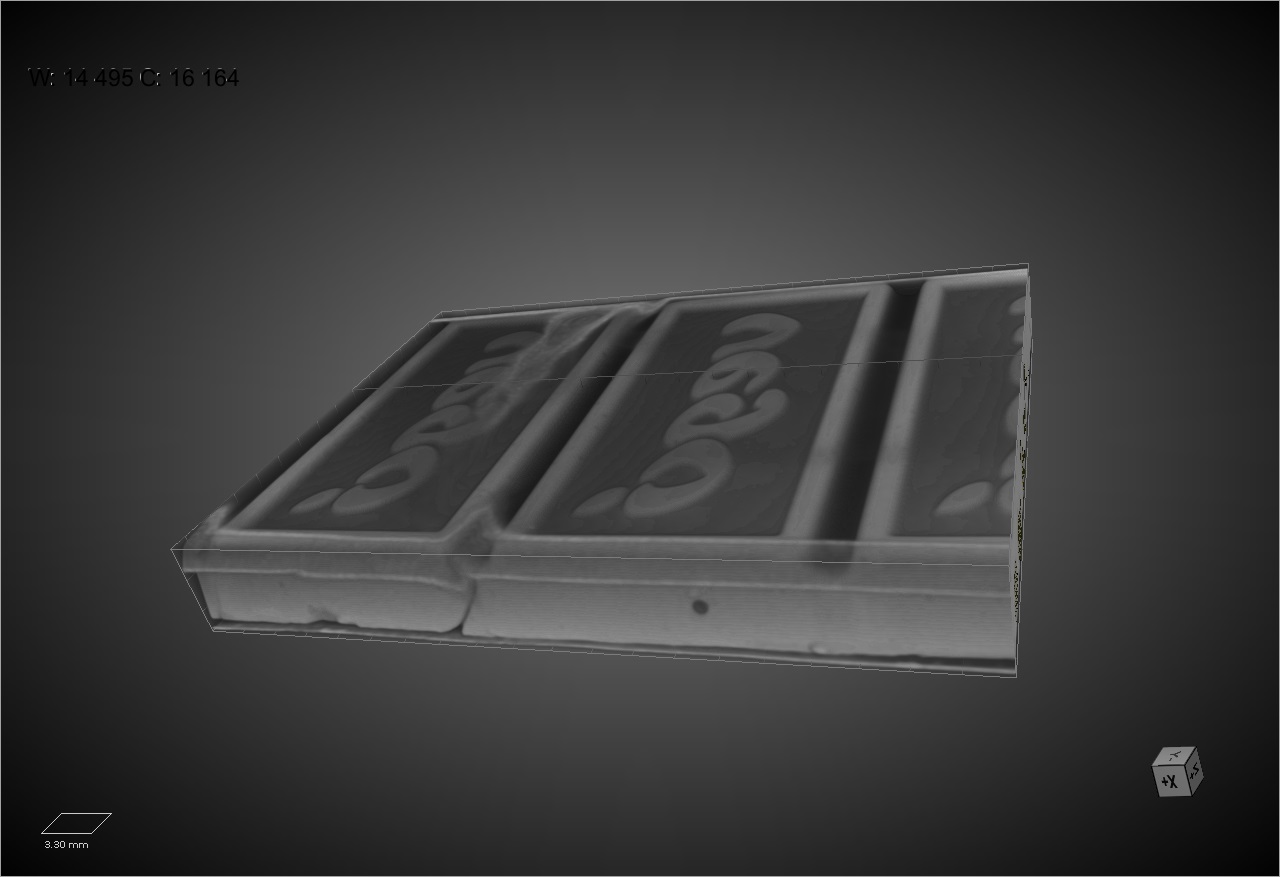
Chocolate bar quantification in 3D
For the needs of a study, Reactiv’IP developed a specific python macro based on the IPSDK library to quantify the volume ratio of porosity and hazelnuts present in a chocolate bar acquired by CT-Tomography.
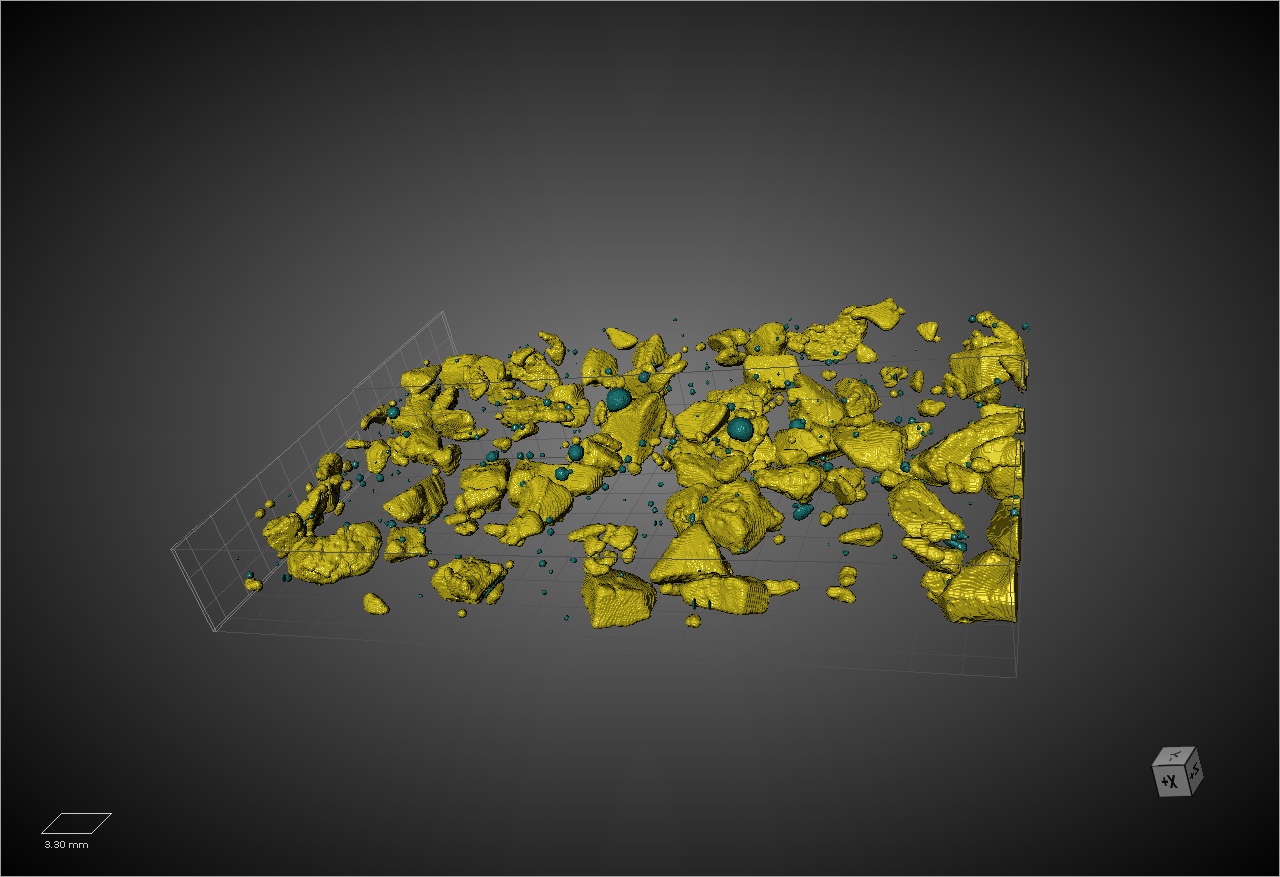
Zoom on a part of the image to display segmented hazelnuts in yellow and segmented voids in green.
This system allows to quickly measure the quantity and of the 3D distribution of hazelnuts inside the chocolate bar .
Thanks to this segmentation we obtain these measures:
Volume ratio of hazelnuts = 12 %
Volume ratio of voids= 0.1 %
Process
The Python script uses several filtering and morphological operations. In a first time, it detects the binary mask of the chocolate bar. Then, it segments successively the hazelnut area and the void area. It would be also possible to separate all objects to compute a granularity histogram.
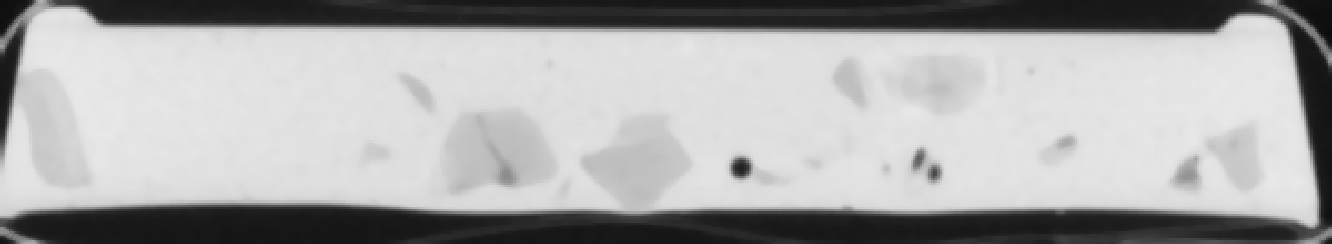
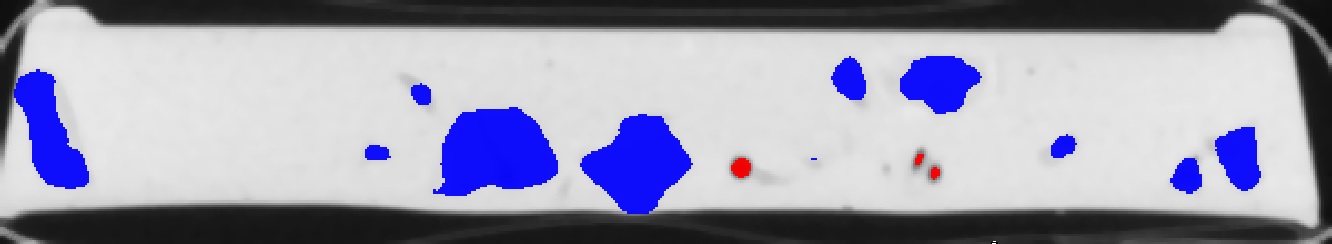
See below a slice of the chocolate bar with the voids and the detected hazelnuts in overlay.