3D crack segmentations on inconel tubes
In partnership with EDF and Cetim, the aim of this project was to realize a robust and accurate tool to identify, segment and measure 3D cracks in inconel tubes. The 3D images were achieved at the synchrotron of Grenoble. It was RX 3D micro-tomography and the resolution was about 13 µm.
3D crack depth measurement
The application was realized thanks to the IPSDK library in oder to ensure an optimal segmentation speed. The interface was created in the Visilog development environment. The application appears as a single control window allowing to process the detection in a series of calculations:
- select the crack type to detect (external or internal),
- detect the tube mask,
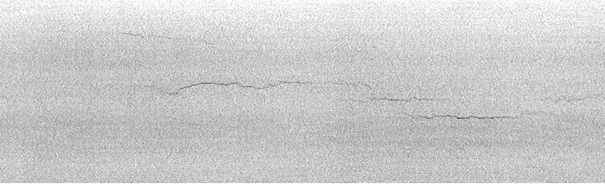
- generate the unrolled tube image,
- interactively select cracks on the unrolled tube image,
- process the cracks 3D segmentation,
- compute the measures on the cracks (thickness, depth, localization, angle portion, etc.)
- generate the depth profile.
Successive steps
The application process chain is logical. The pre-process allows to generate the unrolled image. Then the operator iteratively selects a crack in this image, which is then automatically segmented in 3D by the application. Each new measured fissure comes to complete the concise resulting array.
Unrolled exterior 2D image
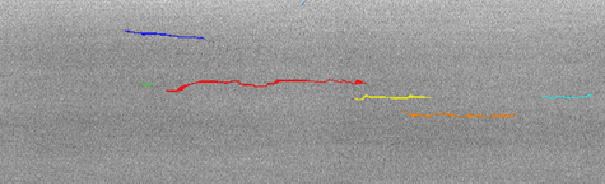
Automatic 2D segmentation on the unrolled image
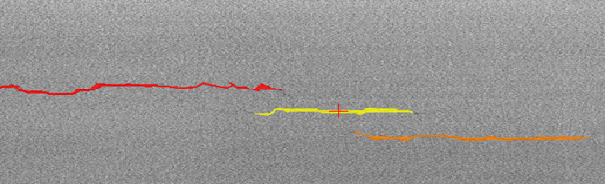
Iterative selection of cracks to segment
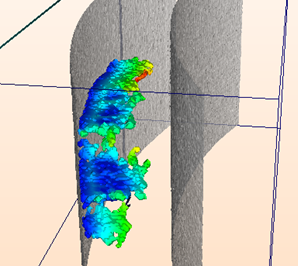
3D display of the segmented crack
Measure accumulation for each crack in a global array
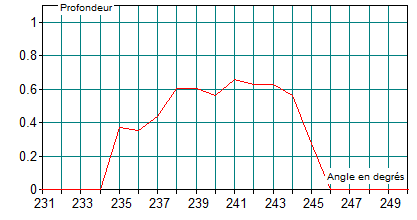
Depth profile of the crack according to the angular position
Report
In order to provide a document summarizing the entire information set, a complete report is provided. Each report presented an unrolled image with the set of cracks processed, and for each crack, a 3D display, the depth profile and the calculated measure results.

Unrolled image with all the processed cracks
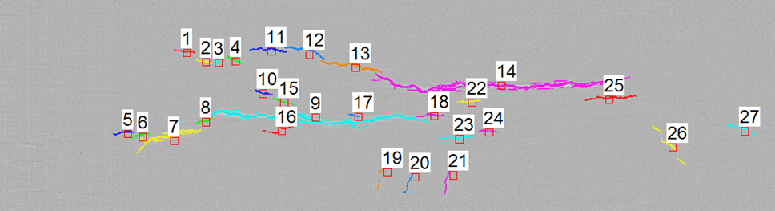
Unrolled image with all cracks numbered
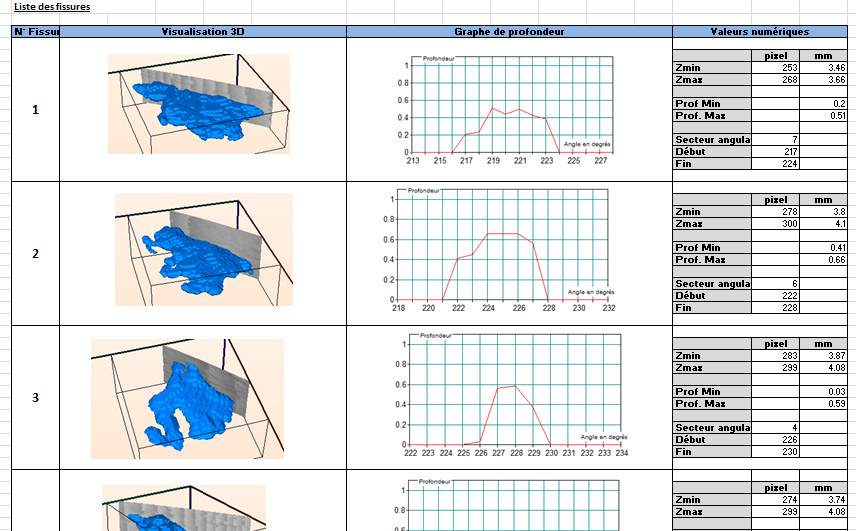
Complete report with all the measures for each crack